 It’s no secret that mobile websites are the new big thing in web development. And while the number of devices that support a decent mobile browser have been rapidly increasing for some time, the development tools for us to build and test these sites are just emerging. Unfortunately, there’s no way on a mobile device for us to natively inspect individual page elements or see what styles are applied to elements. This is especially troublesome when it comes to developing a responsive design, where the styles that are applied are the most important thing to consider. It was while trying to solve this exact problem that I came upon Opera Dragonfly. Being one of the few tools out there, I gave it a try.
And it’s awesome.
 If you want to use Opera Dragonfly’s Remote Debug option, here’s what you’ll have to do. First, you’ll need a desktop computer with the latest version of Opera installed on it (download it here). You’ll also need a mobile device with the full version of Opera Mobile installed on it (Opera Mini doesn’t cut it). Unfortunately, this is only available on Android for the moment, but if you you don’t have an Android device, there are emulators out there that you can use instead. You can download it from the Google Play Store here.
Once you’ve got the correct versions of Opera installed, you’ll want to make sure that both your desktop and mobile devices are on the same wireless network so that they can easily communicate with each other. Once you’re on the network, open up a Command Prompt or Terminal window on your desktop, and run the appropriate command to figure out your IP address (ipconfig on Windows, ifconfig on Mac.) If you have several network adapters, you’ll want to look for the IP address associated with your wireless connection. Once you’ve found it, remember it, you’ll need it later.
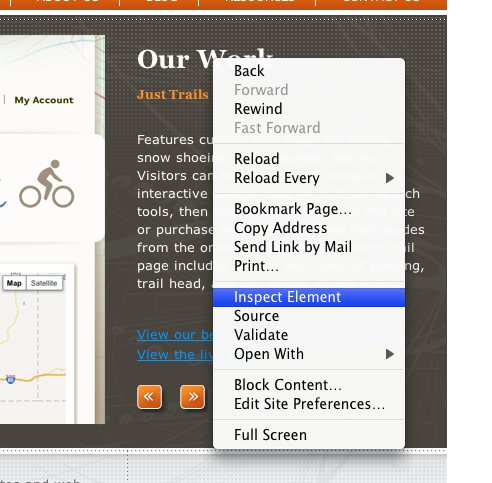
Then in Opera, open up Opera Dragonfly, Opera’s built-in version of Firebug. The menu location of Dragonfly differs depending on what version you’re using, but if you right-click on the page and select ‘Inspect Element’, that should pull it up. Once Dragonfly is active, look for the ‘Remote Debug Configuration’ button at the top of the Dragonfly window, and click it. You’ll see a window with a port number in it (7001 by default). You can change the port number if you want, but there shouldn’t be any problem with leaving it at it’s default value. Once you’ve got your port number entered, click the ‘Apply’ button. If the window says ‘Waiting for a host connection on port XXXX”, you’re good to go.


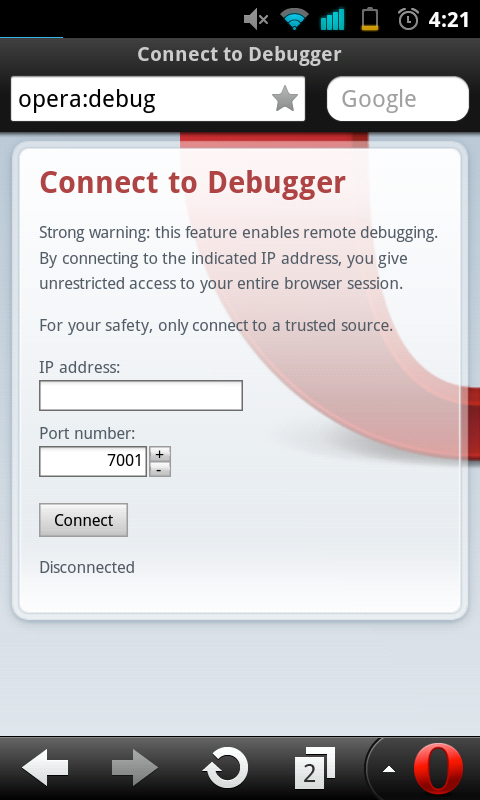
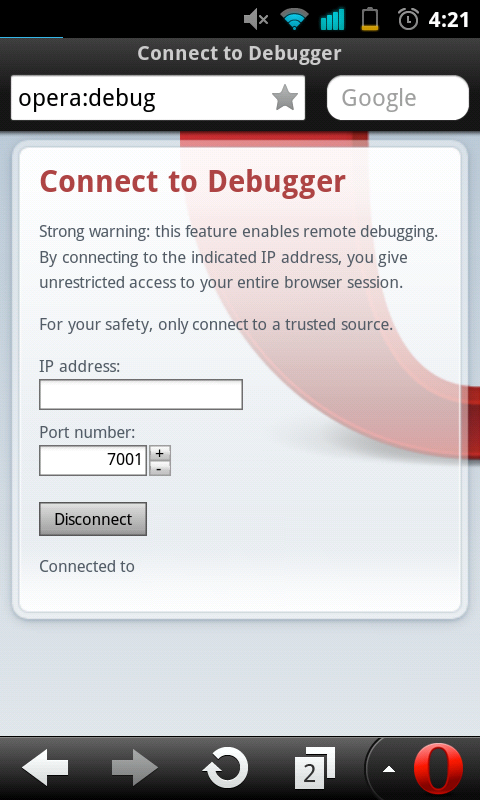
On your mobile device, open up Opera, and go to opera:debug. On this page, you’ll see a text box with an IP address in it, and another for the port number. Fill these in with the appropriate IP address and port number from earlier, and then tap ‘Connect’. The ‘Disconnected’ message at the bottom of the page should change to ‘Connected to <IP ADDRESS>’.


Congratulations! You’ve got the devices hooked up properly! If you get a ‘Failed to connect to debugger at’ error, then something’s gone wrong. Go back and double check your IP Address, Port Number, and Wireless Network. It’s also possible that Firewalls could cause a problem, so if you have one of those enabled, try disabling it.
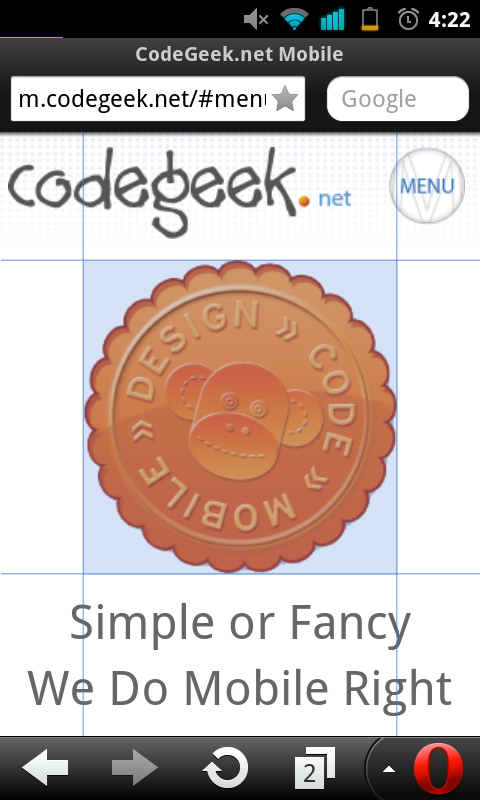
 Once you’ve got the devices linked, you can use the Opera Dragonfly window on your desktop to inspect and interact with the mobile site on your device. On the device, open up a new tab (leave the opera:debug tab open for the duration of the testing, going to a different page will kill the connection.) and navigate to the site you want to troubleshoot. Then on your desktop, click the button in Dragonfly that says ‘Select the debugging context’, and select the tab you want to debug from the dropdown. The main window of Dragonfly should refresh to the HTML and CSS of your site. If it doesn’t, refresh the site on your mobile device.
From this point on, it’s just like using Firebug, but the changes are reflected on your mobile device. Selecting an HTML element in Dragonfly will cause it to be highlighted on the mobile device, and changing a CSS property in Dragonfly will cause that change to be reflected on the mobile site. You also have access to a Script debugger in Dragonfly to debug the scripts on your mobile site, as well as panels to view the page resources and load times, pretty much everything that you’ll need to debug a mobile site!


It’s not a perfect solution, and if your mobile device has a tendency to disconnect your WiFi connection when it goes to sleep, you might want to disable the sleep function, or you’ll end up re-connecting every time you want to change something. And occasionally the two devices just refuse to communicate in the middle of debugging, which is usually solved by disconnecting and setting up the connection again (sometimes a reboot of the device helps too.)
Hopefully this will give you a new versatile tool to help you perfect your mobile sites, and make developing for mobile devices a little easier on you. If you have any other tools or techniques for troubleshooting mobile sites, leave them in the comments!
